

- USD/JPY rallies following soft Canadian jobs data and surge in US Treasury bond yields.
- Bullish engulfing candlestick pattern forms a base for potential upside.
- Technical indicators suggest buying momentum as USD/JPY challenges the 140.00 resistance level.
USD/JPY bounced off weekly lows, and the 20-day Exponential Moving Average (EMA) confluence on Friday after soft jobs data from Canada spurred a jump in US Treasury bond yields. The USD/JPY is trading at 139.37, up 0.32%.
USD/JPY Price Analysis: Technical outlook
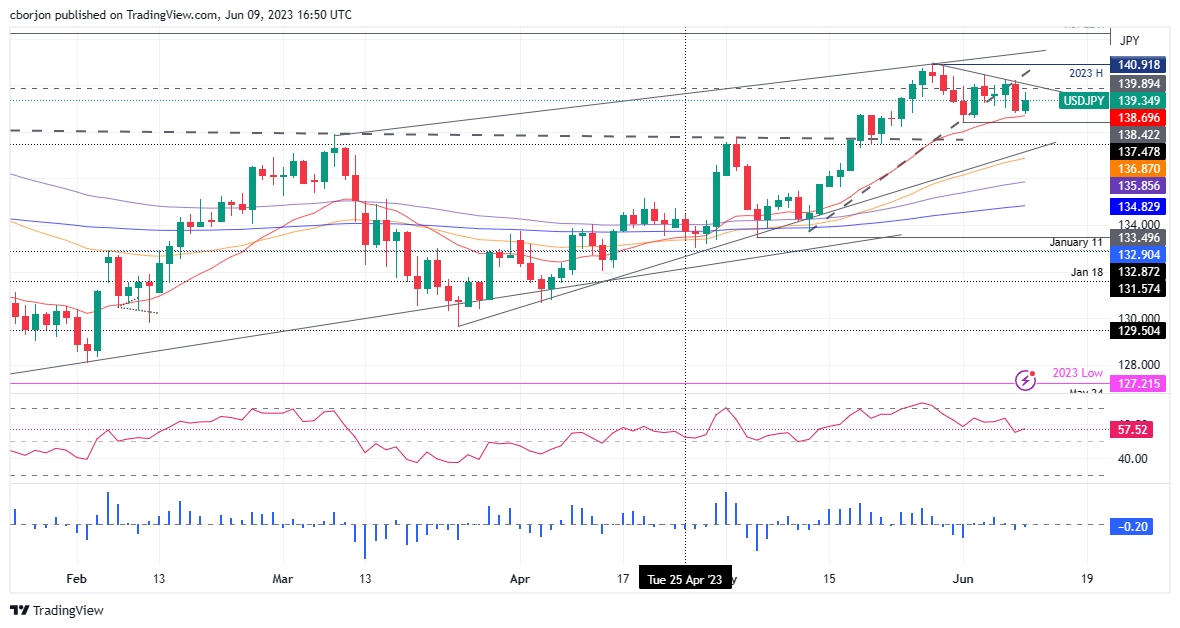
After rallying toward new year-to-date (YTD) highs of 140.91 towards the end of May, the USD/JPY dipped towards 138.40, as threats of a possible intervention by Japanese authorities triggered four consecutive days of losses. Amidst those plays, US Treasury bond yields, edging lower, added another reason to the downturn. Since then, a bullish engulfing candlestick pattern formed, creating a base at around the 138.40s area, which was tested on Thursday, but sellers failing to crack below the 20-day EMA at 138.69, kept support intact, as buyers get ready for an assault toward 140.00.
Another factor that supports the USD/JPY moving upwards is the Relative Strength Index (RSI) indicator, which sits in bullish territory, while the three-day Rate of Change (RoC) suggests buyers gathering momentum as the RoC approaches neutral levels.
Therefore, USD/JPY’s first resistance would be 140.00. A breach of the latter will expose the weekly high at 140.45, ahead of challenging the YTD high at 140.91. On the other hand, a dip below 139.00 could open the door to test the bottom of the abovementioned range at around 138.40.
USD/JPY Price Action – Daily chart
Information on these pages contains forward-looking statements that involve risks and uncertainties. Markets and instruments profiled on this page are for informational purposes only and should not in any way come across as a recommendation to buy or sell in these assets. You should do your own thorough research before making any investment decisions. FXStreet does not in any way guarantee that this information is free from mistakes, errors, or material misstatements. It also does not guarantee that this information is of a timely nature. Investing in Open Markets involves a great deal of risk, including the loss of all or a portion of your investment, as well as emotional distress. All risks, losses and costs associated with investing, including total loss of principal, are your responsibility. The views and opinions expressed in this article are those of the authors and do not necessarily reflect the official policy or position of FXStreet nor its advertisers. The author will not be held responsible for information that is found at the end of links posted on this page.
If not otherwise explicitly mentioned in the body of the article, at the time of writing, the author has no position in any stock mentioned in this article and no business relationship with any company mentioned. The author has not received compensation for writing this article, other than from FXStreet.
FXStreet and the author do not provide personalized recommendations. The author makes no representations as to the accuracy, completeness, or suitability of this information. FXStreet and the author will not be liable for any errors, omissions or any losses, injuries or damages arising from this information and its display or use. Errors and omissions excepted.
The author and FXStreet are not registered investment advisors and nothing in this article is intended to be investment advice.