

We survived jobs week and Federal Reserve Chairman Jerome Powell talking to Congress, with mortgage rates ending the week below 7%. But will mortgage rates keep heading lower? If so, what will this do to inventory levels? Let’s look at this week’s tracker data to get clues for the future.
Mortgage rates and the 10-year yield
The 10-year yield is the key for all my housing work, so I focus on it religiously. In my 2024 forecast, I put the 10-year yield range between 3.21%-4.25%with a critical line in the sand at 3.37%. If the economic data stays firm, we shouldn’t break below 3.21%but if the labor data gets weaker, that line in the sand will be tested at 3.37%.
This means mortgage rates should stay between 5.75%-7.25% with a baseline assumption that the spreads will be bad for most of the year. The 10-year yield has traded above 4.25% this year, but mortgage rates didn’t reach 7.25%so the spreads have acted better than I thought they would.
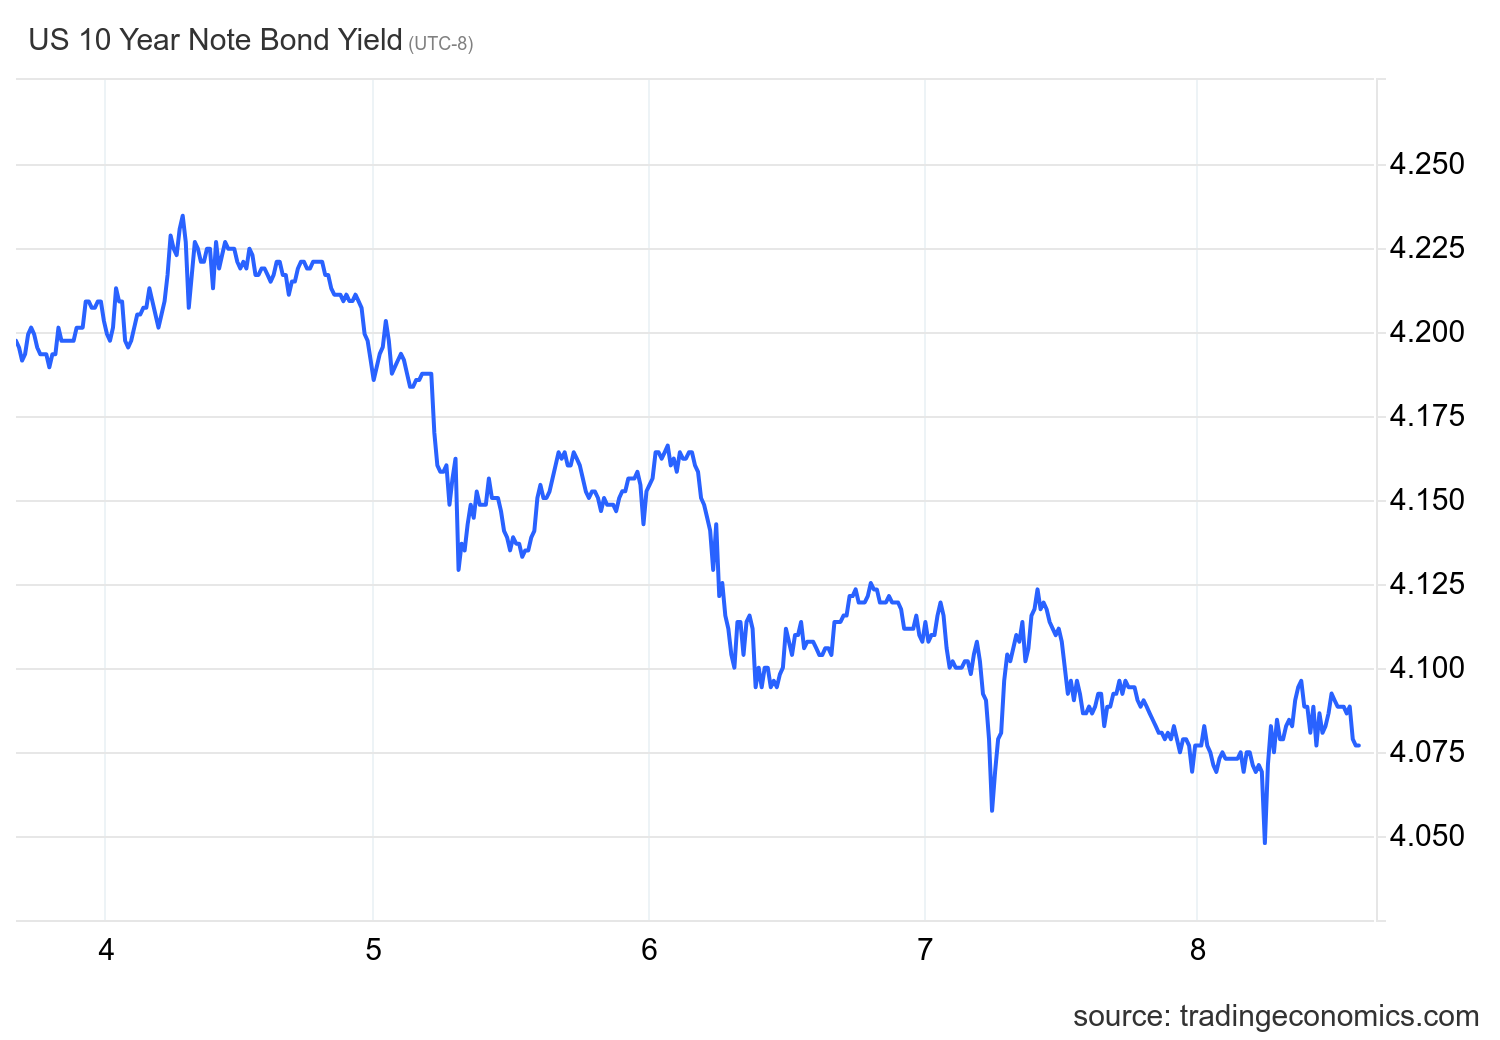
We recently dodged a bullet when the 10-year yield got close but didn’t break above 4.34%, which could have led to mortgage rates back to 8% again. We have bounced off that key line several times and last week, even with jobs data and Powell talking to Congress, the 10-year yield headed lower and mortgage rates ended the week at 6.85%. The chart below shows last week’s 10-year yield trading (March 4-8).
In the chart below, you can see why I have discussed the critical levels for the 10-year yield in the past: the bottom is around the 3.80% level and the top is the 4.34% level. We haven’t broken either yet. Given our current economic data and without a new critical global event, this range should stick. It’s a plus for mortgage rates that the U.S. dollar isn’t getting stronger but slowly falling — the world can’t handle it getting more robust. Powell said that Fed policy is restrictive, so if the 10-year yield breaks above 4.34%, I expect the Fed to be more dovish as they don’t want policy to get too restrictive.
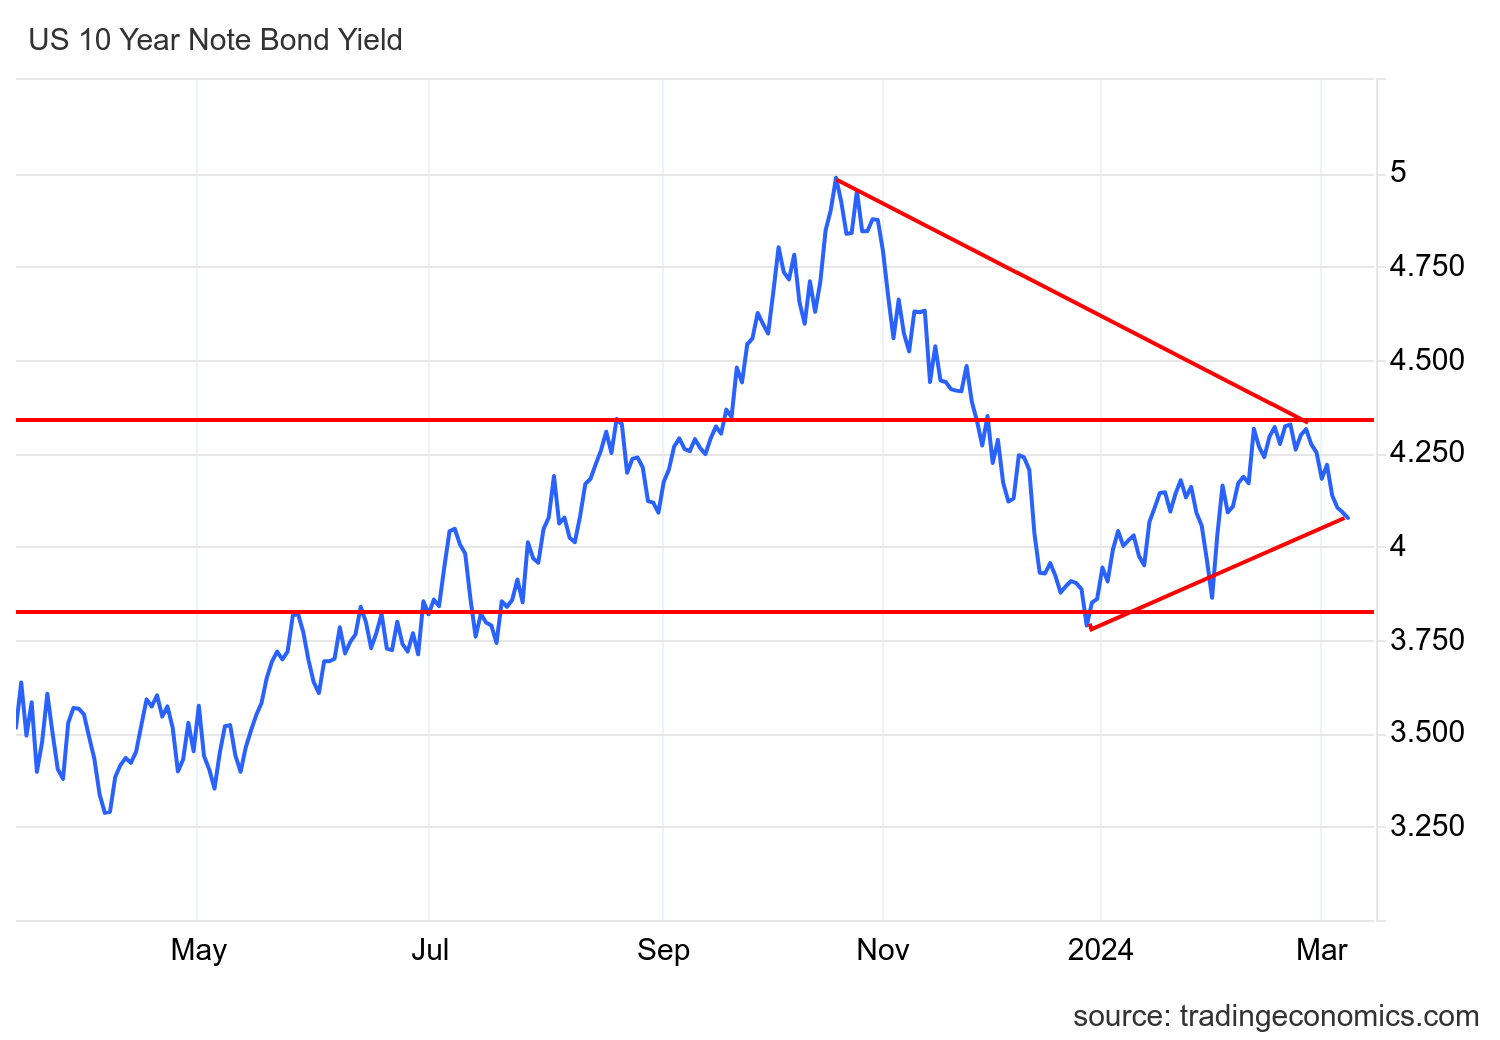
Here is a longer-term look at the 10-year yield to give you the scale of the move in recent years.
Purchase application data
As mortgage rates rose from 6.63% to 7.16% earlier this year, we had five straight weeks of negative purchase application data, something we didn’t see last year. However, that changed last week. With rates going lower, we saw 11% week-to-week growth.
Since November 2023, we have had nine positive and five negative purchase application prints after making holiday adjustments. Year to date, we have had three positive prints versus five negative prints. This is a carbon copy of what happened in 2023 when rates went higher. However, we were worked from a lower bar in home sales last year. Moving the needle doesn’t take much since we all know we have buyers ready to go and home sales are at record lows.
Weekly housing inventory data
The positive story for housing in 2024 has been the inventory growth we have seen year-over-year. Yes, I know it’s not a lot of homes, but growth is growth, people! The farther away we stay away from the savagely unhealthy housing market of March 2022, the happier I will be.
Now, one thing about the year-over-year inventory data, the seasonal bottom last year happened on April 14, which was the longest time ever to find a seasonal bottom. With this information at hand, the year-over-year comps will show more growth than a traditional year, when we would find a seasonal bottom in January or February.
Here is a look at inventory last week:
- Weekly inventory change (March 1-8): Inventory rose from 498,339 to 500,579
- The same week last year (March 2-9): Inventory fell from 419,419 to 413,199
- The all-time inventory bottom was in 2022 at 240,194
- The inventory peak for 2023 was 569,898
- For some context, active listings for this week in 2015 were 971,965
New listings data
New listings data is growing yearly, but it’s still a bit too low for my liking in 2024, as I was hoping for more of a rebound because this data line was running at the lowest levels ever recorded in 2023. However, growth is growth, and if we can match spring 2022 and 2021 levels, I will be a happy camper.
Weekly new listing data for the last week over several previous years:
- 2024: 59,243
- 2023: 50,687
- 2022: 59,661
For some historical context, new listing data this week in 2011 was 362,248.
Price-cut percentage
Every year, one-third of all homes take a price cut before selling — this is regular housing activity and this data line is very seasonal. The price-cut percentage can grow when mortgage rates move higher and demand gets hit. When rates fall, they go lower than an average year.
Inventory is higher than last year, and we might have found the bottom already in inventory, so as the year progresses, the number of homes taking a price-cut should increase. The goal is to see how the mortgage rate variable plays into this data line.
Here is the price cut percentage for the last week over the past several years. As you can see below, in 2022 when inventory was at all-time lows and mortgage rates were sub-4 %, the price-cut percentage data was at a savagely unhealthy low level.
- 2024: 30.5%
- 2023: 30.6%
- 2022: 16.7 %
Week ahead: Inflation week Is here
We are going from jobs week into inflation week when we will get CPI and PPI inflation reports. The CPI data will be interesting because every nerd in America said the same thing about the last CPI report. The report included a giant odd OER print that deviated wildly and made the data hotter than it should have. We shall see if that normalizes in this report or the next. As we all know, the apartment boom-to-bust is creating more disinflation data with apartment rents. If the inflation reports come in much softer than anticipated, we can see lower mortgage rates continue this week.